Alluvial
Key Takeaways:
Alluvial (groundwater) contributes approximately 10% of the total annual yearly inflow to the Reservoir. Groundwater concentrations of phosphorus are higher than the average of all inflows, and similar to Cherry Creek. Groundwater concentrations of nitrogen are significantly lower than the other Reservoir inflow sources.
Long-term concentrations of total phosphorus in the alluvial inflow (MW-9) to Cherry Creek Reservoir are more consistent than surface water inflows (CC-10). Note that the alluvial groundwater concentrations consistently hover around the 200 µg/L background phosphorus level in the streams. In WY 2019, the median TP concentration of the alluvial inflow was 252 μg/L.
The historical pH at this site appears to be relatively stable over time. However the historical conductivity increasing trend is significant.
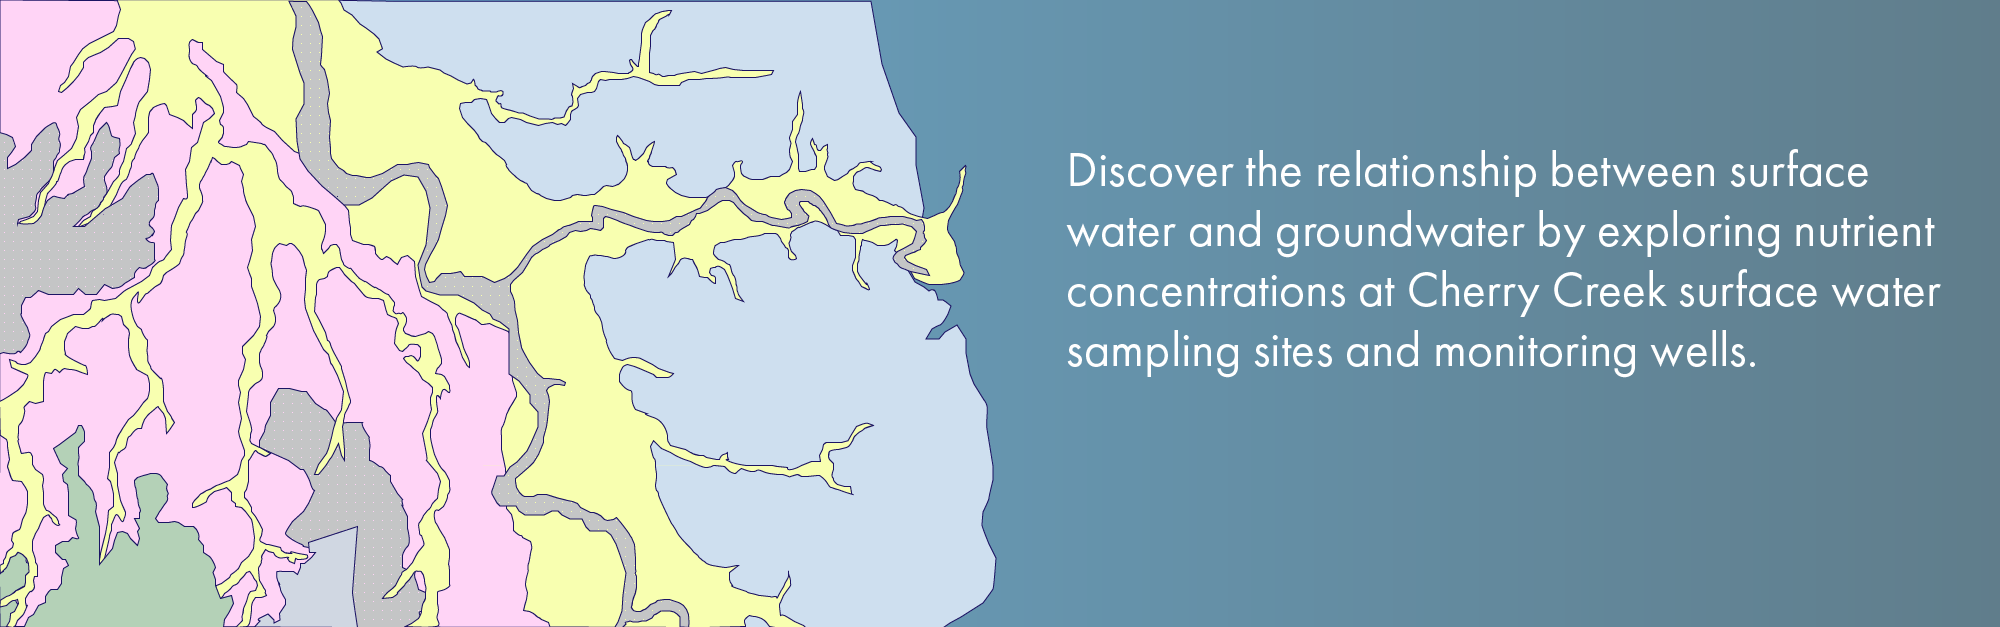
Why does Alluvial Water Quality Matter?
Groundwater travels more slowly than surface water to the reservoir. CCBWQA samples groundwater to investigate the contribution and timing of past and current pollutant loads that originate underground.
Nutrient Concentrations: Alluvial and Surface Water Comparisons
info_outlineEach point on this graph represents a sampling event. The different point colors represent different locations. To learn more about a specific data point, hover over it with your mouse.
Hey! This page is interactive.
- Change the start and end dates to look at different time periods
- Investigate different parameters using the parameter dropdown list
- Select the surface water and groundwater location you would like to compare
- To learn more about a specific data point, hover over it with your mouse