Stream Flows
Key Takeaways:
When looking at the last 28 years, flows at the USGS Cherry Creek Near Franktown (located near the center of the watershed) were 17% less than average and flows at the USGS gage near Parker (located in the lower 1/3 of the watershed) were 14% above average. Urbanization patterns are a factor in CCCR’s water quality and flows.
The yearly summary for the USGS Cherry Creek Near Franktown, Colorado, listed an annual total flow of 2,369 AF with and an Annual Daily mean of 6.49 AF for WY 2019, which is approximately 71.5 percent of the annual mean discharge of 9.1 AF calculated from WY 1940 - WY 2019.
The yearly summary for the USGS Cherry Creek Near Parker, Colorado, listed an annual total flow of 4.724 AF and an Annual Daily mean of 11.3 AF, which is approximately 114 percent of the annual mean discharge of 11.3 AF calculated from WY 1992 - WY 2019.
Proportion of Flows into Cherry Creek Reservoir
Cherry Creek contributes the majority of surface water that flows into the reservoir.
The estimated WY 2019 flow at CC-10, just upstream of the Reservoir on Cherry Creek totaled 14,447 AF with an average daily discharge of 39.7 AF (20 cfs). The estimated WY 2019 flow at the CT-2 monitoring site located upstream of the Reservoir on Cottonwood Creek totaled 3,754 AF with an average daily discharge of 10.3 AF (5.2 cfs).
Useful Links
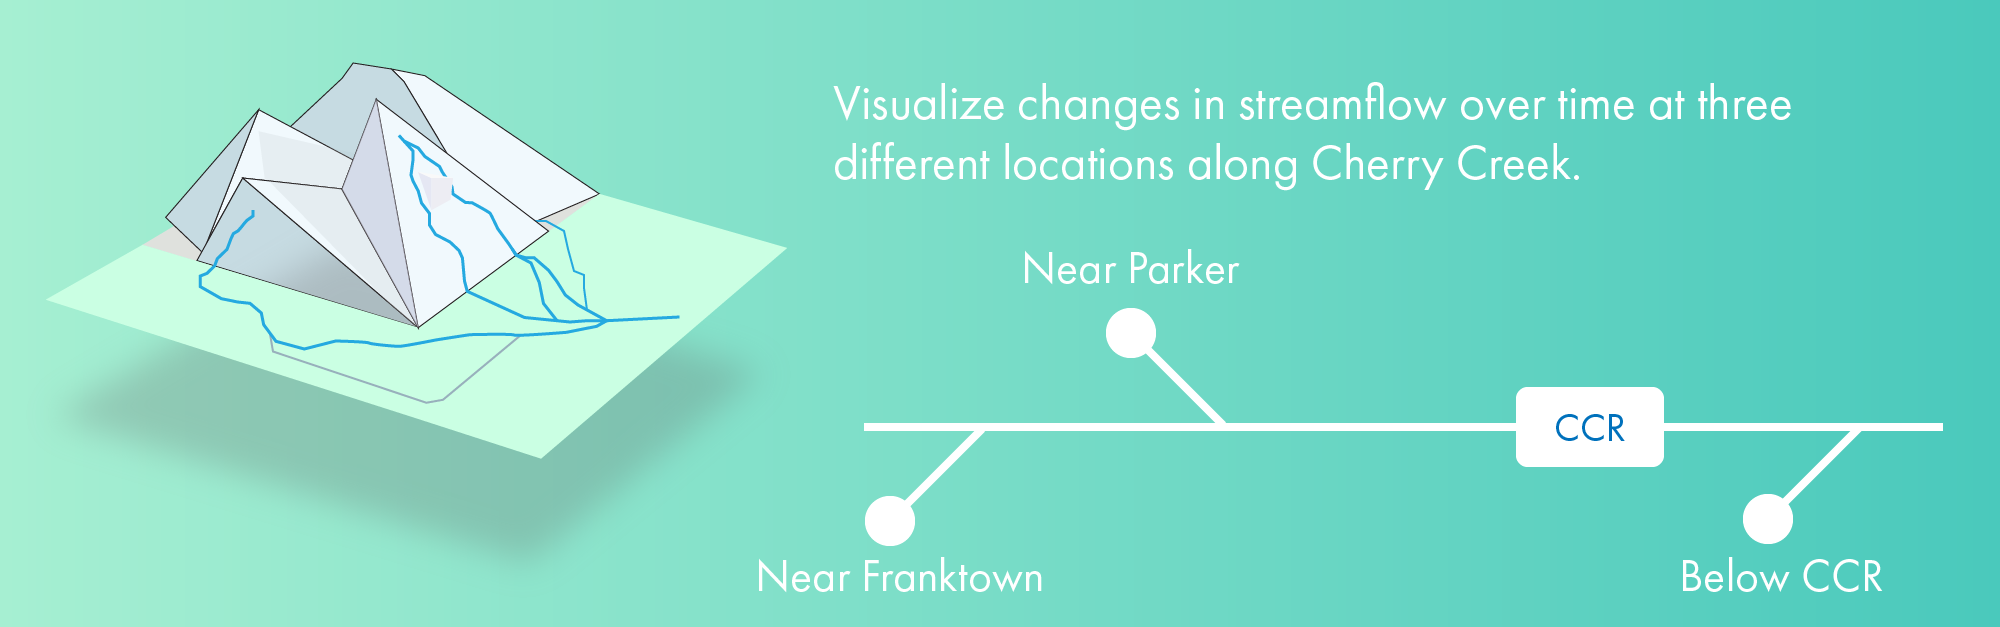
info_outlineVisualize streamflow over time at three different sites along Cherry Creek. The sites are ordered from most upstream to most downstream.
Hey! This page is interactive.
- Change the start and end dates to look at different time periods.
- Click a site name to display the USGS graph for that site.