Nutrients Depth Profile
Key Takeaways:
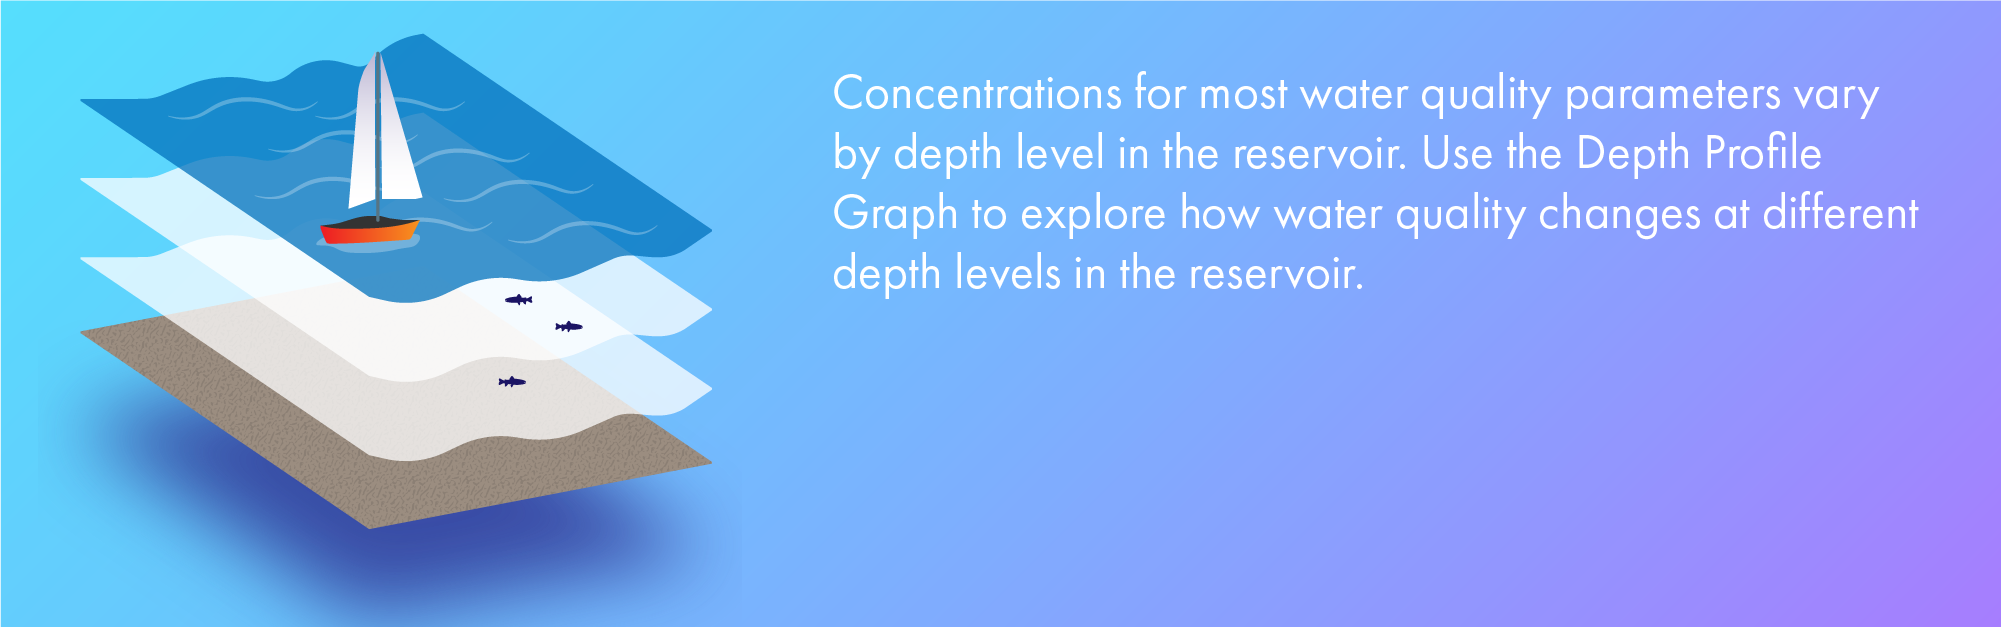
CCBWQA samples nutrients through the Reservoir at various depths to help understand internal loading (i.e., the amount of nutrients that go into the water from the sediments at the bottom) and variability within the water column. Typically, the profiles show that internal loading is more likely when water temperatures are higher and dissolved oxygen is lower at the bottom of the Reservoir. In addition, bio-available nutrient concentrations are usually lower at the surface (or photic zone) when being utilized by phytoplankton or algae.
Total phosphorus (TP) concentrations generally increased with depth. TP concentrations were elevated in the hypolimnion (lower layer of water in a stratified lake) from early spring through summer. Phosphorus increases in the hypolimnion can be caused by internal loading or result from the decomposition of algal cells and other organic matter settling from higher levels in the water column. Inflows of cold runoff water, which have a higher density than warmer, surface waters and sink to the bottom as they enter a lake, can also directly increase hypolimnetic nutrient concentrations, especially in Reservoirs.
The three monitoring events on July 8th, July 23rd and August 5th, 2019 demonstrated significantly elevated TP above 200 µg/L at the 7 m depth and at the 5 and 6 m samples on July 23rd as well. These samples were all collected after the de-stratification system had been shut down for the season on July 4th.
Total phosphorus is made up of both particulate and dissolved phosphorus. Particulate phosphorus includes both inorganic material, such as soil particles and clay minerals, and organic phosphorus, which includes particulate forms such as algal cells and plant fragments. Total dissolved phosphorus includes dissolved organic and inorganic material. Dissolved inorganic phosphorus is usually reported as soluble reactive phosphorus, which represents the bioavailable form of phosphorus. The reactive or bioavailable forms of nutrients are readily available for uptake by algae or cyanobacteria.
During WY 2019, TN levels were higher through the water column during the May 7 and July 23 monitoring events. The TN in the photic zone sample was significantly higher than the rest of the Reservoir on March 22, 2019. Also, in the October and November 2018 samples the TN concentrations from the 7 m depth sample were much higher than the samples higher up in the water column.
Nutrients Depth Profile
info_outlineEach square on this depth profile represents a sampling event. The different square colors represent the magnitude of the the value for the a sampling event. To learn more about a specific data point, hover over a square with your mouse.
Hey! This page is interactive.
- Change the start and end dates to look at different time periods
- Investigate different parameters using the parameter dropdown list
- View different locations using the surface water location list
- To learn more about a specific data point, hover over a square with your mouse.