PRF Monitoring
Highlights:
During 2021:
- The Cottonwood Creek “treatment train” reduced Phosphorus and Suspended Solids in base and storm flow conditions.
- Monitoring provided additional data inputs for the PRF statistical analysis tool available on the data portal.
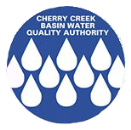
The Cherry Creek Basin has multiple pollution reduction facilities (PRFs) in various locations through the watershed. The Cottonwood Creek Pollutant Reduction Facilities provide phosphorus and sediment reduction during storm events. Together, stream reclamation and wetland detention systems comprise a passive treatment train approach widely implemented by CCBWQA throughout the basin since the 1990s as an effective water quality strategy.
The Cottonwood Creek PRF treatment train (Peoria Pond, Phases 1 and 2 of stream reclamation completed on Cottonwood Creek downstream, and the Perimeter Pond) functioned by reducing TP concentrations by approximately 12% under base flow conditions and 80% during the storm events characterized in WY 2021. Sediment concentrations, measured as TSS, were reduced by approximately 42% under base flow conditions and 94% during the storm flow event. Based on the differences in reduction during high and low flow events, these PRFs functioned as designed to reduce phosphorus and sediment loading during WY 2021. Additionally the upstream to downstream concentrations of TP on McMurdo Gulch were reduced by 26% during base flows collected in WY 2021. However, more detailed (and statistical) historical analysis of the changes from upstream to downstream can be completed using the PRF tools (linked below).
Summary of Reductions in Nutrient and Suspended Solids in CCBWQA PRFs*
* ◌ - reductions of less than 20%, ○ - reductions between 25-50%, ● - reductions of >50%, blank cells indicate no reduction or an increase upstream to downstream
Learn More in the WY 2021 Monitoring Report
Useful Links
Cottonwood Creek Treatment Train
Summary
Upstream to Downstream Concentrations Over Time
Net Change Over Time
Percent Change Over Time
Hey! This page is interactive.
- Change the start and end dates to change the dates on the graph
- To learn more about a specific data point, hover over it with your mouse.