Field Measurements
Highlights:
The Reservoir met the aquatic life standards for temperature, dissolved oxygen and pH in WY 2020.
The Reservoir met the temperature standards established for the Class I Warm Water Aquatic Life classification established by the Water Quality Control Commission (WQCC) in Regulation No. 31 (Reg 31) of 26.2 ˚C Maximum Weekly Average Temperature (MWAT) and 29.3 ˚C Daily Maximum (DM). The maximum temperature measured during the reservoir monitoring events and the continuous monitoring thermistors was 23.8˚C (74.8 ⁰F).
Reg31 states that in ”the upper portion of a lake or reservoir, dissolved oxygen shall not be less than 5.0 mg/L. There needs to be adequate refuge for aquatic with DO levels greater than 5.0 mg/L available at other depths or locations in the Reservoir at the same time period.”
During WY 2020, there were events when measured DO concentrations in parts of the Reservoir were below 5.0 mg/L. For example, during WY 2020, DO levels were below 5.0 mg/L from 5 meters to the bottom at CCR-2 in mid-July through August and at 2 meters and below on July 27th. However, during the same time period, the DO concentrations at the other monitoring sites measured concentrations greater than 5.0 mg/L, meeting the Reg 31 standard. Periods of low dissolved oxygen indicate high microbial activity or decomposition in the hypolimnion and sediments which reduces DO concentrations.
During WY 2020, the pH ranged between 7.9 and 8.8, which meets the instantaneous minimum and maximum standards of 6.5 and 9.0, respectively. The higher pH values appeared to correlate with higher productivity and elevated chlorophyll α in the reservoir.
Useful Links
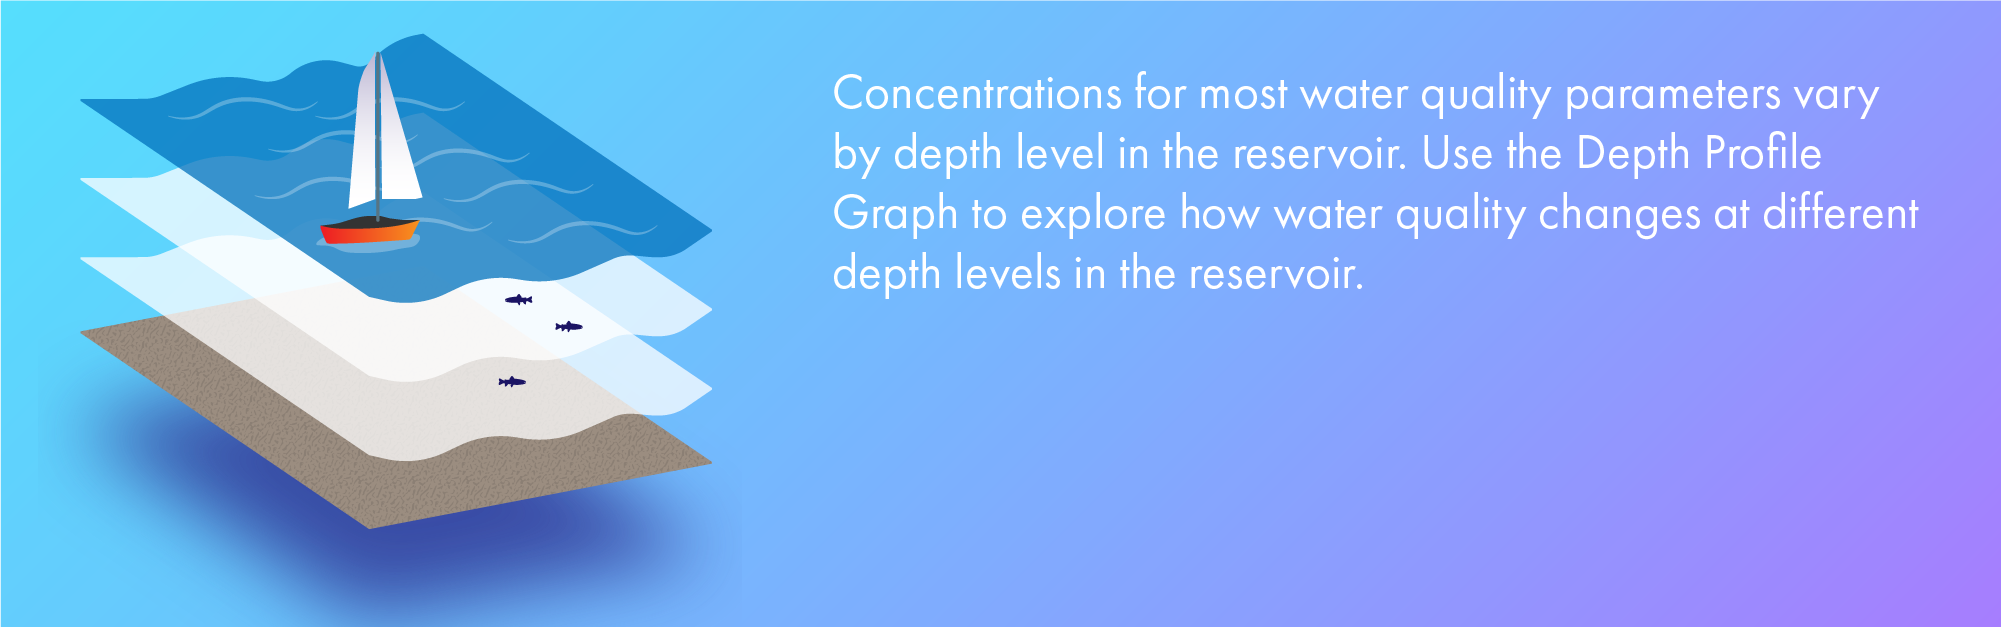
Reservoir Depth Profile: Temperature, Dissolved Oxygen, pH and Oxidation Reduction Potential
info_outlineEach square on this depth profile represents a sampling event. The different square colors represent the magnitude of the the value for the a sampling event. To learn more about a specific data point, hover over a square with your mouse.
Hey! This page is interactive.
- Change the start and end dates to look at different time periods
- Investigate different parameters using the parameter dropdown list
- View different locations using the surface water location list
- To learn more about a specific data point, hover over a square with your mouse.