CCR Inflow Concentrations
Cherry Creek flows from south to north to the reservoir through a 245,000 acre drainage basin. The basin includes various types of land use, including both agriculture and heavy development, as well as permitted discharges in and around Cherry Creek. Cottonwood Creek is the other major surface water input to Cherry Creek Reservoir. Cottonwood Creek has a much smaller watershed, more developed land use and no permitted discharges like Cherry Creek.
The flow-weighted total phosphorus (TP) concentration at Cherry Creek station CC-10 for WY 2018 was 236 μg/L, which was slightly higher than WY 2017 (229 μg/L), and on the lower end of the average concentrations during the previous 8 years, which ranged between 231 μg/L and 276 μg/L.
The WY 2018 flow-weighted average TP concentration for Cherry Creek station CC-10 remains much higher than the WY 2018 flow weighted total phosphorus concentration of 79 μg/L calculated for station CT-2 in lower Cottonwood Creek.
The WY 2018 flow-weighted nitrogen concentration for Cottonwood Creek were higher than those observed in Cherry Creek (1,984 μg/L at CT-2, compared to 1,833 μg/L at CC-10). Flow- weighted nitrogen concentrations were higher at both CC-10 and CT-2 in WY 2018 than in WY 2017.
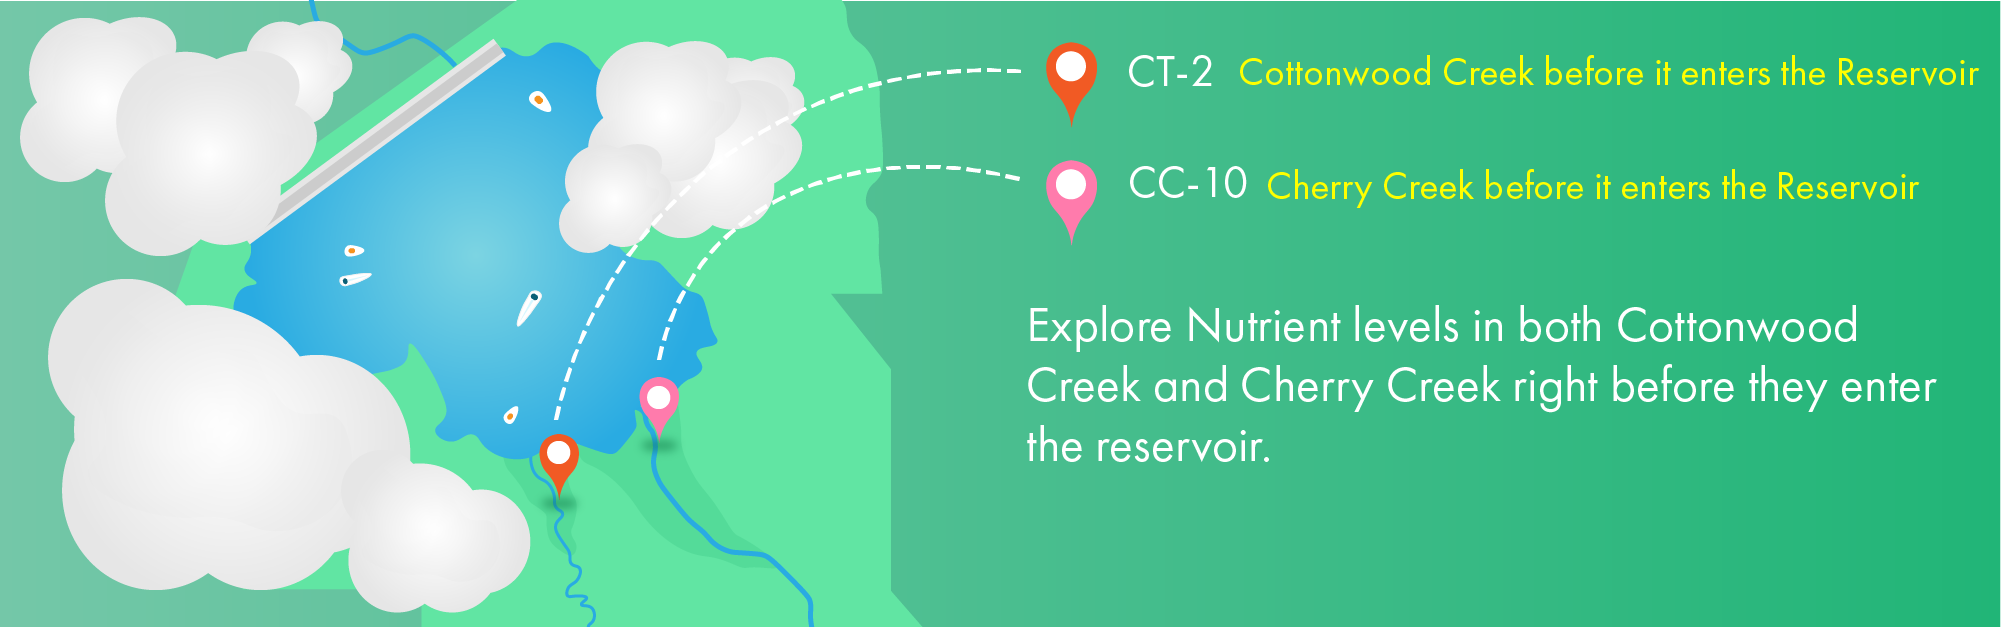
Why are CT-2 and CC-10 Important Monitoring Locations?
CT-2 and CC-10 are important monitoring locations because they allow us to understand what is flowing into the reservoir. Having an understanding of what is happening upstream of the reservoir is crucial in understanding the health of the reservoir.
Useful Links
Nitrogen Concentrations, CC-10 and CT-2
info_outlineEach point on this graph represents a sampling event. The different point colors represent different locations, while the filled and hollow icons indicate whether the parameter is total or dissolved. To learn more about a specific data point, hover over it with your mouse.
Phosphorus Concentrations, CC-10 and CT-2
info_outlineEach point on this graph represents a sampling event. The different point colors represent different locations, while the filled and hollow icons indicate whether the parameter is total or dissolved. To learn more about a specific data point, hover over it with your mouse.
Hey! This page is interactive.
- Change the start and end dates to change the dates on the graph
- To learn more about a specific data point, hover over it with your mouse.